Amazon Statistics 2025: Revenue, Users, Sellers
E-commerce has gone from a niche experiment to the beating heart of global retail, and no company symbolizes that shift more than Amazon.
From its early days as an online bookstore in the mid-90s, Amazon has grown into a trillion-dollar giant that touches nearly every corner of the digital economy.
Alongside it, the broader e-commerce world has exploded — billions of shoppers now buy everything from groceries to gadgets online, creating opportunities and challenges for sellers in every niche.
The numbers behind this story are staggering: trillions in annual sales, hundreds of millions of active customers, millions of third-party sellers, and hours upon hours of daily engagement through mobile apps.
But behind those figures lies something even more interesting: who shops, what they buy, how much they spend, and which platforms or regions dominate the playing field.
By digging into profitability, demographics, product categories, and global market shares, we can start to see the full shape of today’s online shopping universe — and maybe even where it’s heading next.
What’s Amazon’s net income?
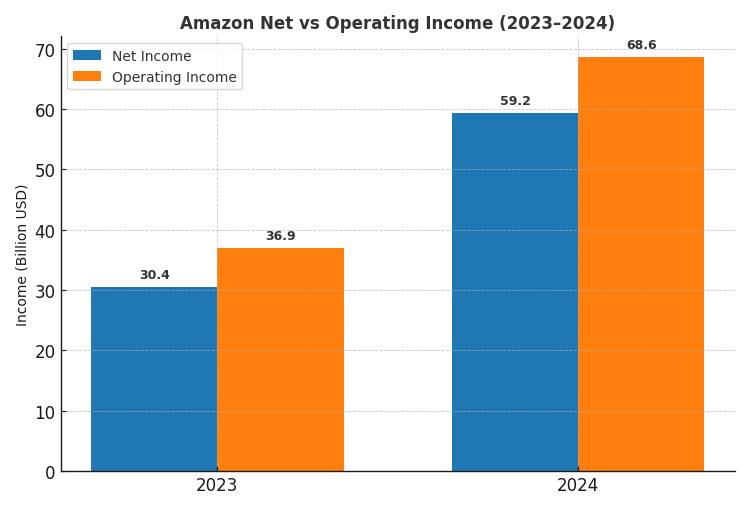
In 2024, Amazon posted a net income of approximately USD 59.25 billion, which is nearly double its 2023 net income of about USD 30.43 billion. That’s a year-over-year increase of ~94.7%.
Here’s a table showing recent figures:
| Year | Net Income (USD billions) |
| 2023 | ~ 30.43 |
| 2024 | ~ 59.25 |
Some additional points to put that into context:
- The good jump in profit was helped by improved margins, especially in Amazon Web Services (AWS), plus better performance in its North America segment.
- Operating income also rose significantly, from about USD 36.9 billion in 2023 to about USD 68.6 billion in 2024. That reflects not just more revenue, but also better efficiency, cost control or more profitable mix of business.
- In a quarterly snapshot: in Q4 2024 alone, Amazon’s net income was around USD 20.0 billion, up from USD 10.6 billion in Q4 2023.
So bottom line: Amazon’s profitability in 2024 saw a big rebound versus 2023, roughly doubling its net income. If you want, I can also pull up forecasts (what analysts expect for 2025+) or break down how much of that profit came from AWS vs retail.
How much revenue does Amazon make a year?
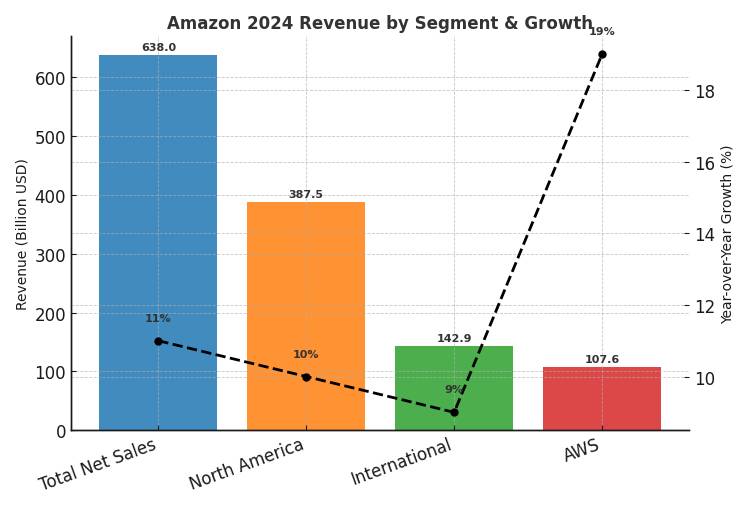
In fiscal year 2024, Amazon’s total revenue (net sales) was about USD 638.0 billion, up roughly 11% from around USD 574.8 billion in 2023.
The growth wasn’t evenly spread: sales in North America rose to about USD 387.5B from USD 353B, an increase of ~10%; International revenue increased ~9% to USD 142.9B; while Amazon Web Services (AWS), its cloud business, jumped ~19% to ~USD 107.6B.
Here’s a table summarizing recent revenue by region / segment:
| Segment / Region | Revenue in 2024 (USD billions) | Year-over-Year Growth |
| Total Amazon Net Sales | ~ 638.0 | +11% vs 2023 |
| North America | ~ 387.5 | +10% |
| International | ~ 142.9 | +9% |
| AWS | ~ 107.6 | +19% |
Some additional context makes the picture richer: of Amazon’s total revenue, the online stores segment (i.e. product sales via its digital marketplaces) remains its largest individual business line.
For example, in 2024, online stores accounted for about USD 247.03 billion—which is close to 39% of Amazon’s total revenue. Advertising, AWS, physical stores, international marketplaces, and other services fill out the rest.
So, in short: Amazon rakes in well over half a trillion dollars a year in sales (USD 638B in 2024), growing steadily, with its cloud business and international operations being among the faster-growing pieces. If you want, I can also pull up projections for revenue in 2025 and beyond.
How many customers does Amazon have?
Here’s what recent data shows about how many customers Amazon has — there are different ways to count them (active users, Prime members, etc.), so I’ll lay out several angles so the picture feels clear.
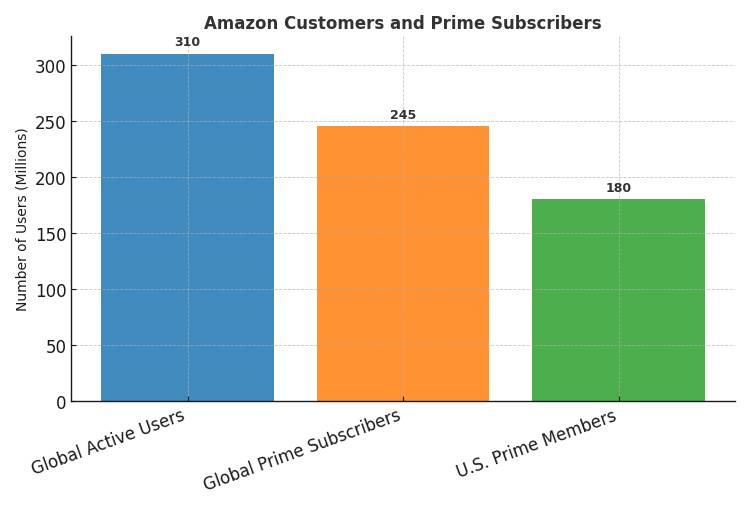
Amazon has over 310 million active customers/users globally. These are people who use Amazon (browse, buy, etc.), though “active” is not precisely defined and may vary by source.
When it comes to Amazon Prime, which is their paid subscription service tied to faster shipping, streaming, perks etc., there are around 240-250 million Prime subscribers worldwide in 2025 per recent estimates. In the U.S. alone, Prime has about 180 million members.
Here’s a comparison in table form:
| Metric | Approximate Number | Notes |
| Global active Amazon users/customers | ~ 310 million+ | “Active” meaning people using Amazon, not necessarily purchasing every period. |
| Prime subscribers globally | ~ 240-250 million | Paid members who get Prime benefits. |
| U.S. Prime members | ~ 180 million | Reflects U.S. market specifically. |
A few caveats:
- “Active customer” could mean someone who made at least one purchase in a period, or someone who simply logged in; definitions vary.
- Prime membership counts are slightly more reliable because it’s a subscription (paid), but Amazon doesn’t always publish the most recent official numbers; many figures are estimates.
- Growth tends to be slower now than in earlier years (because base is large), but even small percentage increases represent tens of millions of users.
The bottom line: Amazon has a massive user base (300-plus million), and Prime alone accounts for a large chunk of that (about 240-250 million).
The U.S. is a major component, but much of the growth is global. If you want, I can try pulling up customer counts for specific regions (e.g. Southeast Asia or the Philippines) so you can compare locally.
How many people sell on Amazon?

Here’s what current data tells us about how many people sell on Amazon, along with a few nuances to keep in mind.
Amazon has around 9.7 million registered sellers globally. Of those, about 1.9 million are active—meaning they are actively listing, selling or fulfilling orders.
Some additional stats help put the scale into view:
| Metric | Approximate Number |
| Total registered Amazon sellers worldwide | ~ 9.7 million |
| Active sellers (globally) | ~ 1.9 million |
| U.S. active sellers | ~ 1.1 million |
Some more fine points:
- “Active” doesn’t always mean “successful” or “profitable”—some sellers list a product without much ongoing activity.
- Over 60% of Amazon’s total sales come from independent or third-party sellers, most of whom are small to medium-sized businesses.
- In 2024, more than 55,000 independent sellers generated over USD 1 million in sales.
In short: while nearly 10 million people or entities are registered as sellers on Amazon, only a subset (roughly 2 million globally) are actively selling.
If you want, I can break down how many sellers are in specific categories (e.g. by product type or region) so you can see what the competition looks like in your niche.
Where do Amazon’s customers come from?
Amazon’s customer base is heavily skewed toward North America, particularly the United States, though international users also make up a sizable share.
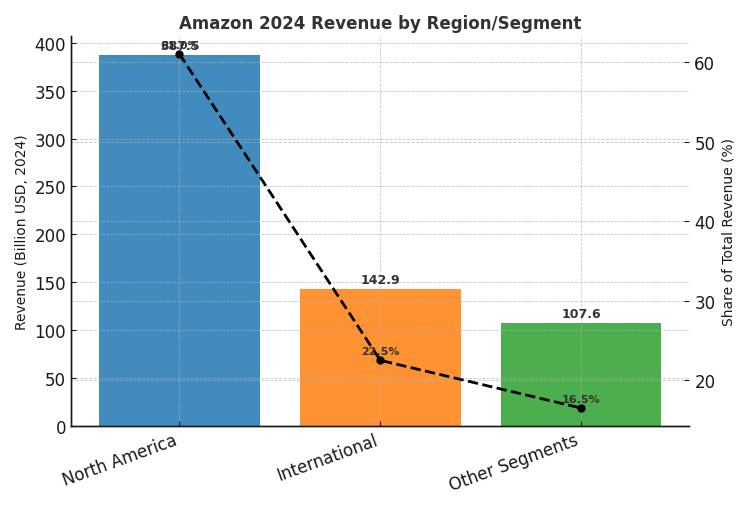
In 2024, Amazon reported that of its total annual revenue of USD 638 billion, about USD 387.5 billion came from its North America segment (primarily the U.S.), while its International segment contributed around USD 142.9 billion.
Here are some numbers to help break that down:
| Region | Revenue (2024) | Approximate Share of Amazon’s Total Revenue |
| North America | USD 387.5 billion | ~ 61 % |
| International | USD 142.9 billion | ~ 22-23 % |
| Other segments (e.g., AWS, non-product revenue) | Remainder | ~ 15-20 % (depending on segment breakdown) |
Some more details about where customers are located or where traffic comes from:
- The U.S. represents Amazon’s most dominant market by far, not just in revenues but in user base and engagement.
- For example, there are ~ 230 million Amazon customers in the U.S. among the 310 million+ active global users.
- Traffic data also reflects this dominance: in 2024, nearly half of Amazon’s monthly site visits globally came from users in the U.S. (about 47.5%)
“In short,” most of Amazon’s customers are in North America (especially the U.S.), with international customers supplying a significant but smaller share of both visits and revenue.
Regional differences remain big, especially in how much revenue per user and engagement Amazon gets in those different markets.
How old is the average Amazon customer?

Here’s what data shows about how old the average Amazon customer tends to be, along with some age-group breakdowns.
The largest single age group across Amazon’s users is 25-34 years old, which makes up around 28.8% of all Amazon visitors.
Next behind them are the 35-44 year olds, who account for about 19.6%. The 18-24 cohort also contributes significantly — roughly 16.2% of Amazon’s users.
Older age groups gradually decline in share: the 45-54 group comprises about 15.7%, the 55-64 group about 12.1%, and those 65+ around 7.7%.
Putting some of that in table form:
| Age Group | Approx. Share of Amazon Users / Visitors |
| 18-24 | ~ 16.2 % |
| 25-34 | ~ 28.8 % |
| 35-44 | ~ 19.6 % |
| 45-54 | ~ 15.7 % |
| 55-64 | ~ 12.1 % |
| 65+ | ~ 7.7 % |
From all this, we can infer that the “average” Amazon user is probably in their early to mid 30s. Some sources estimate the average somewhere around 37 years old. (start.io)
Also a few nuances worth mentioning: age doesn’t tell the whole story — people in their 30s-40s tend to spend more per order, buy more frequently, etc., whereas younger users may visit more often for browsing.
Also, demographic skews vary somewhat by country; the U.S. user base might look slightly older than global averages because internet access and spending power differ.
What are the best products to sell on Amazon?
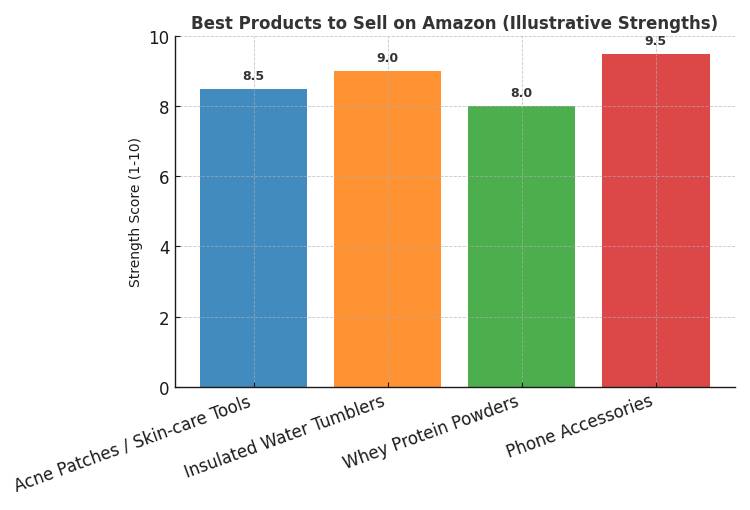
What counts as the “best product to sell on Amazon” depends a lot on demand, competition, margins, and trends — but research shows several categories and specific items that have consistently strong potential.
One major pattern: electronics accessories, beauty & personal care, home & kitchen, pet supplies, and eco-friendly items tend to perform very well.
For example, some of the high‐demand, low‐competition product ideas identified for 2025 include skin care items like acne patches, gua sha tools, and hair growth serums, plus more commodity / repeat purchase items like insulated tumblers, whey protein powders, pet supplies, and phone screen protectors.
Here are a few specifics to highlight what makes a product “best” in practice:
| Product | Why It Works / Key Strengths |
| Acne patches / skin-care tools | Lightweight, compact, often repeat purchase, trending socially, low shipping cost. |
| Insulated water tumblers | High demand (everyday use + gift value), easy to brand/design, good margins. |
| Whey protein powders | Health & fitness trend; people reorder; large potential audience. |
| Phone accessories (screen protectors, chargers) | Heavy demand, small/light to ship, many variant options, always need replacement. |
Some of the “rules of thumb” from the sources: look for products that are small / easy to ship, have frequent or repeat purchase potential, are not extremely saturated in reviews, and ideally tie into ongoing trends (wellness, eco, remote work, home improvement, etc.).
On the flip side, very large or bulky items, highly regulated goods, items with very thin margin are riskier. What’s “best” also depends on how much you can invest in inventory, branding, listing quality, and advertising.
But overall, if someone wants a starting point, focusing on accessories, beauty/skincare, small home goods, and eco-friendly or wellness products usually gives a strong shot.
What do women buy on Amazon?
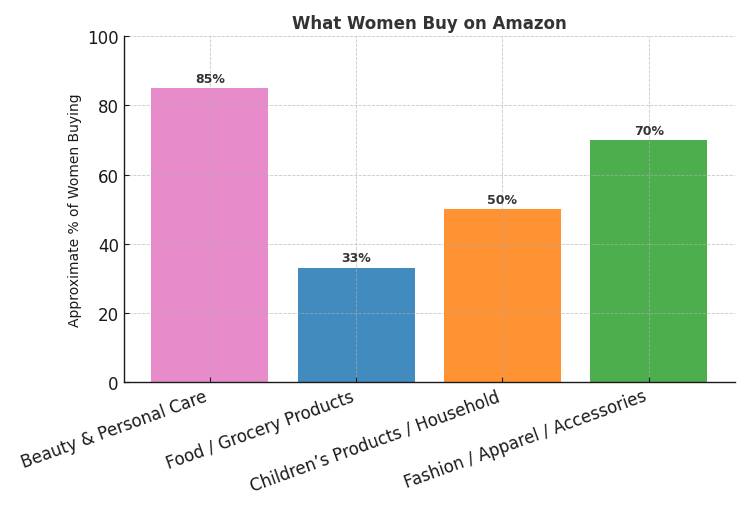
Women are a dominant force among Amazon shoppers. Recent studies estimate that 75% of Amazon buyers are female. This skew isn’t just about numbers—it shows up in what women tend to purchase, how often, and why.
A breakdown of what women frequently buy includes:
| Product Category | Approximate % of Women Buying These | Key Insights / Behavior Patterns |
| Beauty & Personal Care | ~ 85 % | High frequency, often repeat purchases; driven by both self-use & gift purchases. Women Buying Beauty & Personal Care |
| Food / Grocery Products | > 33 % (over one-third) | Women are more likely than many other groups to include grocery & pantry items in regular Amazon orders. Same study |
| Children’s Products / Household | Significant but not quantified precisely | Because many women influence or make household buying decisions, purchases tied to children (toys, clothing) and home (cleaning, decor) are common. (Touching on themes in consumer-profile research) |
| Fashion / Apparel / Accessories | Very frequent in female shopper cohorts | These often combine trend, identity, price sensitivity, and convenience; women look for variety, fit, reviews. |
Additional behavioral details:
- Among female users, many shop frequently — weekly or bi-weekly in many cases — especially for consumable & replacement items (beauty, personal care, groceries).
- The convenience factor is huge: free/fast shipping (e.g., via Prime) is often cited as key, along with ease of comparison among brands and user reviews.
- Women are also more likely to start their product research on Amazon; the site often acts as both search engine + marketplace for them.
A few caveats:
- Some of the data comes from surveys or panels rather than Amazon-disclosed metrics, so definitions vary (e.g. what counts as “buying regularly” vs “once in a year”).
- Percentages like “85% buy beauty & personal care” are high, but don’t always capture how much is spent, or profit margin per category.
Putting it together, if you’re selling on Amazon and your target customer is a woman, just about every category tied to personal value (beauty, wellness), household needs (groceries, kids), and fashion are strong candidates.
Understanding which sub-segment (age, income, lifestyle) helps refine which product types will sell best.
How much do Amazon users spend on the app?
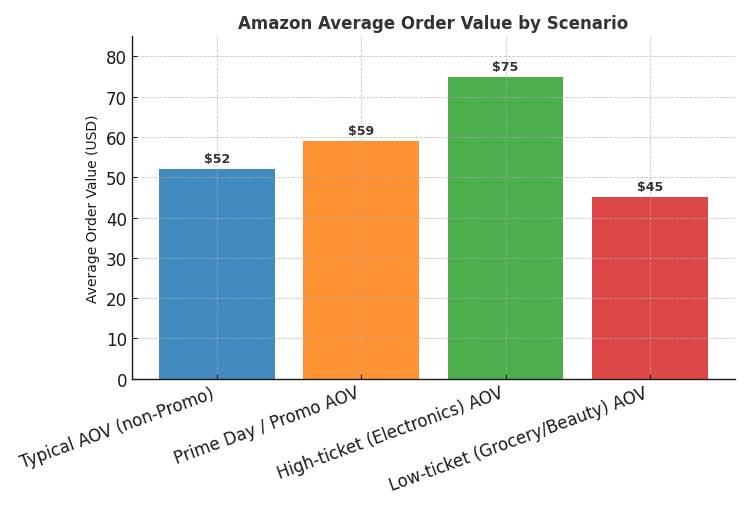
One commonly cited metric is Average Order Value (AOV) across Amazon purchases: during regular periods, the AOV is around USD 52 per order. Promos, Prime Day, and special events push that average up (~ USD 58-60 during Prime Day).
Categories matter a lot: electronics or home improvement items tend to have higher AOVs (sometimes well over USD 75), while groceries, beauty, and smaller items often bring in <$50 per basket.
Some reports suggest Amazon app users are more active, making more purchases, or using the app more frequently than non-app/browsing users.
There was data showing Amazon app users together spent around 12.8 billion minutes per month in the app, which implies heavy engagement. But that’s about time spent, not directly about dollars spent.
Here’s a table summarizing key spend / value metrics:
| Metric | Approximate Value |
| Typical Average Order Value (non-Promo) | ~ USD 52 per order |
| Prime Day / Promotion Period AOV | ~ USD 58-60 |
| Electronics / High-ticket Category AOV | USD 75+ in many cases |
| Low-ticket / Grocery / Beauty AOV | < USD 50 often |
Caveats: “How much do Amazon users spend on the app” is tricky to pin down because “app user” vs “web user” behavior isn’t always separated in reporting.
Also, some buyers place many orders a year; others are occasional. Prime members tend to spend more per order and more frequently. Plus, country, currency, and product category all shift the numbers around.
So in short: Amazon users tend to spend around USD 50-60 per order under normal circumstances, higher during deals.
How much time do Amazon users spend on mobile?
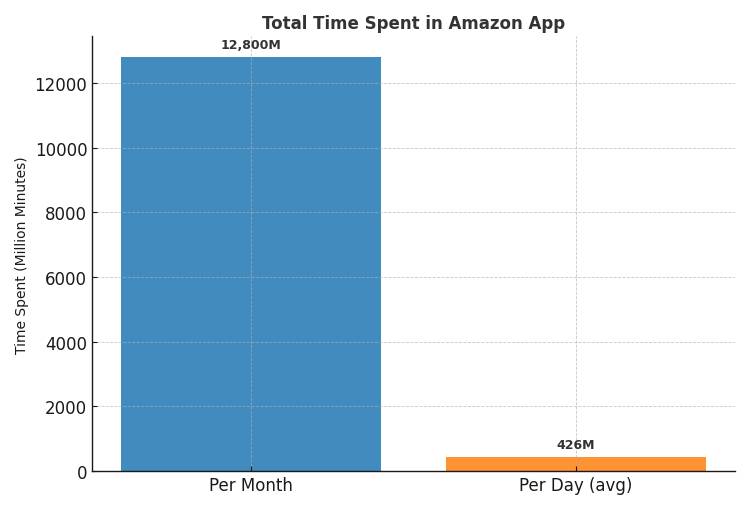
Here’s what recent data reveals about how much time Amazon users spend on mobile — there are some good figures, though the insights are a bit fuzzy since Amazon doesn’t always break things down by device in publicly available reports.
- One reliable metric: Amazon app users spend 12.8 billion minutes per month using the Amazon Shopping app. That number reflects total combined time across all users globally.
- To put that in perspective, that’s roughly 213 million hours per month if you divide minutes by 60. If you then divide by 30 days, that’s about 7.1 million hours per day spent by users in the app.
Here’s a rough table to help the visualization:
| Time Period | Total Time Spent in Amazon App |
| Per Month | ~ 12.8 billion minutes |
| Per Day (average) | ~ 426 million minutes (~ 7.1 million hours) |
- Another useful point: among mobile visitors to Amazon, about 42% are using the Amazon app (rather than browser on mobile). These app users also account for a larger proportion of “time spent” per session.
- Comparatively, mobile browser usage for Amazon (on phones) brings in much less time: about 2.4 billion minutes per month on mobile browser vs 12.8 billion on the app. So the app clearly dominates in terms of engagement.
Some caveats to keep in mind:
- The “minutes per month” number lumps together all app users globally — heavy users, occasional users — so averages may hide big variation.
- Amazon doesn’t always report “average daily time per user in the app,” so we’re working from aggregated usage across its user base.
- Differences by region: time spent on mobile vs desktop, app vs browser may shift a lot depending on country, device penetration, and local internet behavior.
Overall, though, the data clearly shows Amazon users spend substantial time in the app — much more time than via mobile browser — which signals that optimizing for app experience, engagement, notifications, and mobile usability is super important.
What emerges from the data is clear: e-commerce is no longer just “another” retail channel, it’s the engine driving consumer behavior worldwide.
From China’s towering market size to Amazon’s unmatched dominance, from Millennials and Gen Z shaping demand to Prime subscribers fueling loyalty, the entire ecosystem thrives on scale, speed, and personalization.
Certain industries, like electronics and fashion, rake in the biggest numbers, but niches like beauty, groceries, and wellness continue to surge as consumer habits evolve.
Social media platforms, once just for connection, have turned into powerful marketplaces where discovery meets impulse.
And while profits vary — some sellers riding high margins, others squeezed thin — the opportunities are undeniable for those who understand their audience and adapt quickly.
In the end, e-commerce is as much about people as it is about platforms: their trust, their habits, their clicks, and their wallets.
The story keeps shifting, but one thing is certain — the digital marketplace is only going to grow deeper, faster, and more intertwined with everyday life.