Meta Facebook Statistics 2025: Demographics, Time Spent & Business Impact
171 views
In today’s hyper-connected world, technology has woven itself into nearly every corner of our daily lives, from how businesses operate to how individuals socialize, shop, and even manage their time.
Two giants in this evolving digital landscape—virtual assistants and Facebook—illustrate just how dramatically our habits and work structures are shifting.
Virtual assistants, once considered a luxury, are now indispensable across industries, fueling productivity and reshaping the way professionals and enterprises handle tasks.
At the same time, Facebook, now under Meta’s umbrella, remains a cornerstone of global communication and digital engagement, boasting billions of active users and a staggering cultural footprint.
By examining who uses these tools, where they thrive, and what makes them so vital, a fascinating story emerges: one of adaptability, growth, and the constant push to make technology more human-centered.
This exploration looks at the demand for VAs, their most important skills, target markets, and adoption across countries, alongside Facebook’s usership trends, demographics, engagement, revenue, and workforce—painting a full picture of how these forces continue to shape modern life.
How many users does Facebook have?
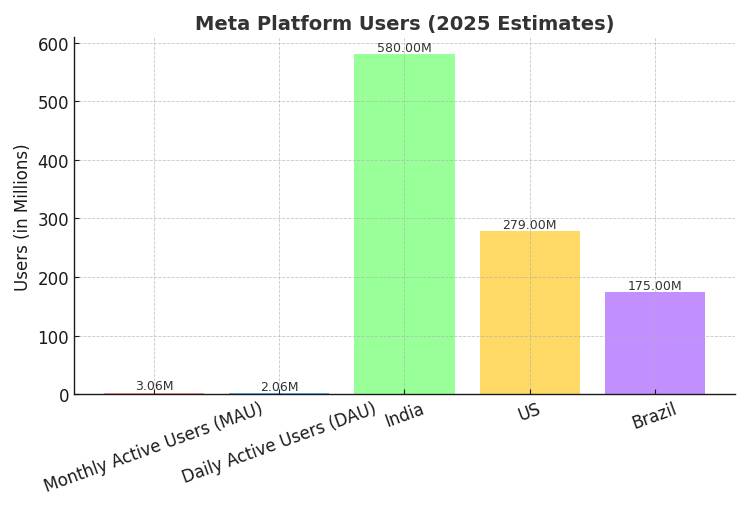
Facebook remains one of the largest social platforms on the planet: as of early-to-mid 2025 it has roughly 3.06–3.07 billion monthly active users (MAUs), which places it at the very top of global reach and means a large slice of the world logs into Facebook at least once a month.
Daily engagement is huge too—about 2.0–2.1 billion daily active users (DAUs) access Facebook on a typical day, showing that a substantial portion of monthly users return every day.
Geographically, the platform’s user base is heavily concentrated in countries with large populations: India alone accounts for hundreds of millions of users, and the United States, Brazil, Indonesia and Mexico are all in the top ranks by country.
Over the last decade Facebook has grown from roughly 1.4 billion MAUs in 2014 to its current three-billion-plus scale, a climb that underlines both platform maturity and continued global adoption.
Putting the numbers in plain English: when you add up monthly users, Facebook reaches somewhere around 40–60% of active social-media users worldwide, depending on how you slice the totals and which platforms you include—so it’s still the broadest single-network reach marketers and communicators can access.
The platform’s penetration varies by region and by age: usage skews older in some markets and remains strong with the 25–34 cohort in many others, and time-spent metrics show people still spend many hours a month inside Facebook’s family of apps.
Metric
Latest estimate (2025)
Monthly active users (MAU)
~3.06 – 3.07 billion.
Daily active users (DAU)
~2.0 – 2.11 billion.
Example country counts
India: ~580M; US: ~278–280M; Brazil: ~175M.
In short, while new platforms rise and attention fragments, Facebook’s raw user numbers remain enormous—giving it unmatched scale for reach, while engagement patterns and regional differences continue to evolve.
What percentage of Facebook users are male?
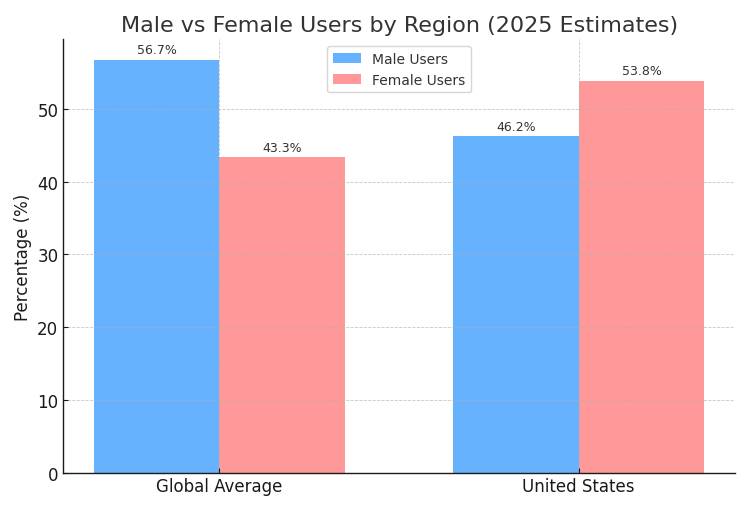
Globally, men make up a slight majority among Facebook users. About 56.7% of Facebook’s audience are male, while 43.3% are female—a clear skew toward men (some sources report close to 55–56% male).
That difference isn’t huge but is consistent across multiple data points. In the United States, the situation flips—more women than men use Facebook, with roughly 53.8% of users being female and 46.2% male.
Region-by-region variations show the picture can shift significantly, depending on cultural context.
Here’s a quick breakdown:
Region
Male Users
Female Users
Global Average
~56.7%
~43.3%
United States
~46.2%
~53.8%
What this tells us in plain terms is that, worldwide, Facebook leans slightly male—but in the U.S., women are actually the bigger force. That gender tilt can shape everything from how content spreads to what trends catch fire and where advertisers choose to spend their money.
What is the average age of a Facebook user?
The largest age group on Facebook globally falls between 25 to 34 years old, making up roughly 31.1% of users—nearly one in three people on the platform are in this bracket, showing its dominant appeal to younger adults.
This is followed by those aged 18 to 24, who account for about 23%, and users aged 35 to 44 at 20.2%, highlighting a solid middle-aged presence as well.) A more granular snapshot from a similar dataset shows:
Age Group
Share of Users
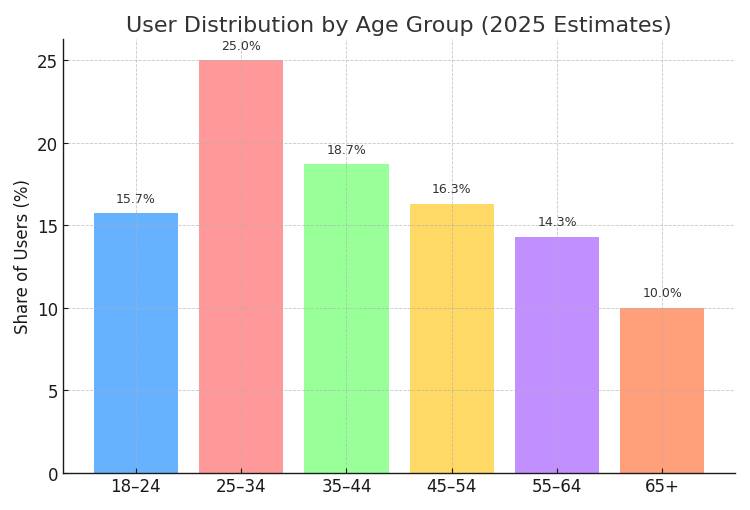
18–24
15.7%
25–34
25.0%
35–44
18.7%
45–54
16.3%
55–64
14.3%
65+
10.0%
This indicates that about 40–50% of Facebook users are under 35 years old, underlining a strong tilt toward younger adults while still maintaining engagement across older age brackets.
In the U.S. specifically, nearly a quarter—24.2%—of Facebook users fall into the 25–34 range, followed closely by 18.6% in the 18–24 bracket and 19% in the 35–44 group.
This suggests that among American users, the platform’s core is still heavily rooted in younger adults, but with healthy representation across the 35–44 range as well.
A quick look at age distribution:
Region
25–34
18–24
35–44
Global
~31%
~23%
~20%
U.S.
24.2%
18.6%
19%
Putting this into everyday terms: Facebook isn’t just a hangout for teens—it has evolved into a platform where young adults (mid-20s to mid-30s) are leading the charge, followed by solid participation from users in their 30s and 40s.
Meanwhile, older generations—like those 55 and above—although smaller in share, still contribute meaningfully to the user base.
The average user age likely hovers in the early-to-mid 30s, though exact numbers aren’t publicly disclosed—what’s clear is that Facebook increasingly spans across the age spectrum, with younger users front and center.
Which countries use Facebook?
Facebook is truly a global platform — used everywhere from dense urban centers to far-flung towns — but the biggest concentrations of users cluster in a handful of populous countries.
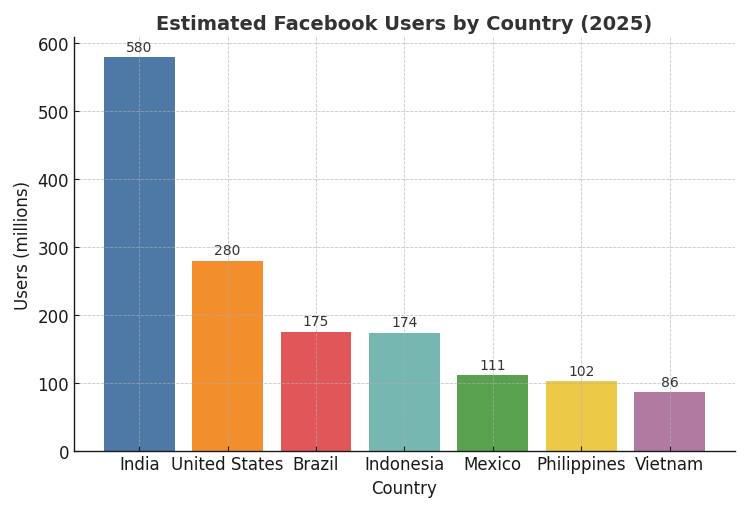
India leads the pack with several hundred million users, followed by the United States, Brazil, Indonesia and Mexico; other large user bases include the Philippines, Vietnam, Russia and Turkey.
Usage patterns vary: some countries show very high penetration (for example, the Philippines and parts of Latin America report Facebook use by a large share of the population), while other large populations (notably China) are largely off the official Facebook map because of local platform differences and restrictions.
What that means in plain terms is this — Facebook’s top national markets are where the world’s people (and its attention) are packed most densely, and advertisers, creators and communicators tune their strategies accordingly.
Here’s a compact table that captures the biggest national audiences (rounded estimates):
Rank
Country
Estimated Facebook Users (approx.)
1
India
~580 million.
2
United States
~280 million.
3
Brazil
~175 million.
4
Indonesia
~174 million.
5
Mexico
~111 million.
—
Philippines
~102 million.
—
Vietnam
~86 million.
Digging a little deeper, regional trends matter: Asia-Pacific and Latin America supply some of the fastest-growing user pools, while penetration in North America and parts of Europe is already high but growing more slowly.
In several emerging markets the platform is the default social layer for news, commerce and community organizing — in short, Facebook is woven into daily digital life for hundreds of millions.
To sum up the practical takeaway: if you’re sizing an audience by country, India and the U.S. are the heavyweight champions in sheer numbers, with Brazil, Indonesia and Mexico close behind; beyond the raw counts, differing penetration rates and local platform landscapes mean one-size-fits-all strategies rarely work — you’ll want to tailor content and ad approaches to each national market’s habits and norms.
How much time do people spend on Facebook?
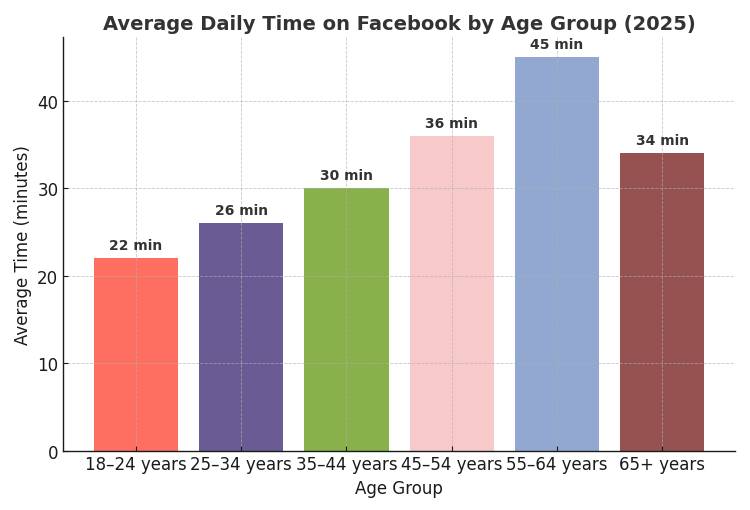
On average, users spend about 30 to 31 minutes per day on Facebook—roughly equivalent to 15 hours each month. This daily average has held steady over recent years, even as overall time on social media platforms has grown. The trend reflects consistent engagement despite fluctuations across different apps.
Younger users tend to spend significantly less time on the platform. For example, those aged 18 to 24 spend only around 22 minutes daily, whereas older users are more engaged: 35–44-year-olds average about 30 minutes, 45–54-year-olds about 36 minutes, and 55–64-year-olds lead the pack at roughly 45 minutes per day.
Here’s a clearer breakdown:
Age Group
Average Time on Facebook (daily)
18–24 years
~22 minutes
25–34 years
~26 minutes
35–44 years
~30 minutes
45–54 years
~36 minutes
55–64 years
~45 minutes
65+ years
~34 minutes
Putting this into everyday terms: the typical Facebook session isn’t marathon scrolling—but it’s more like a quick daily check-in, especially for younger users.
Meanwhile, older generations spend noticeably more time lingering on posts, updates, and community content.
Overall, even if Facebook isn’t the stickiest app out there anymore, it continues to hold a steady daily foothold—especially with older users who value its familiarity and comprehensive content mix.
How many downloads does Facebook have?
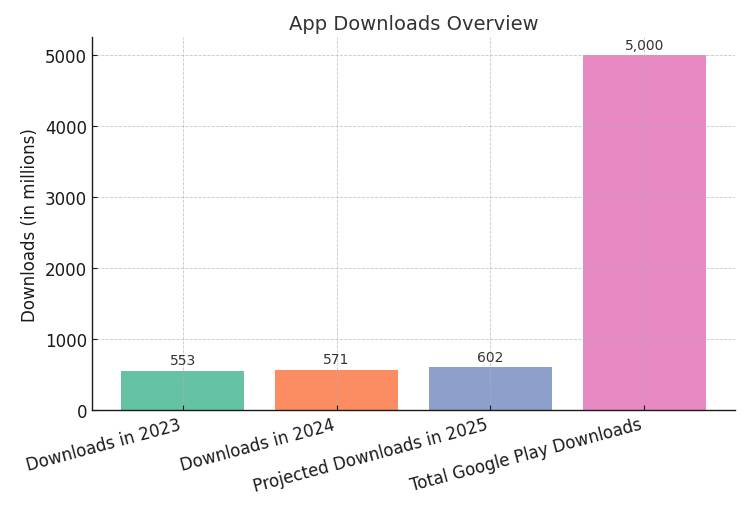
In terms of sheer download numbers, Facebook has proven itself to be a perennial heavyweight. In 2023, the app recorded 553 million new downloads, and 2024 saw an increase to 571 million—highlighting its sustained popularity across app stores.
Projections suggest that by the end of 2025, annual downloads may surpass 600 million, showing that even long-established apps can maintain strong appeal.
Zooming out, the cumulative lifetime impact is staggering. The Facebook app has racked up over 5 billion downloads on the Google Play Store alone, underscoring its global footprint and the massive adoption of Android devices worldwide.
To put those figures into perspective:
Metric
Approximate Figure
Downloads in 2023
553 million
Downloads in 2024
571 million
Projected downloads in 2025
~602 million
Total Google Play downloads
Over 5 billion
Despite being one of the oldest social apps around, Facebook continues to be a major download performer, consistently ranking among the top five most downloaded apps each year.
So when someone asks how many folks downloaded Facebook—whether as new users or reinstalling after a break—the answer is: a lot.
Even after more than a decade in the app ecosystem, it still pulls in hundreds of millions of downloads annually, cementing its place as a digital staple around the world.
What percentage of Facebook users use mobile devices?
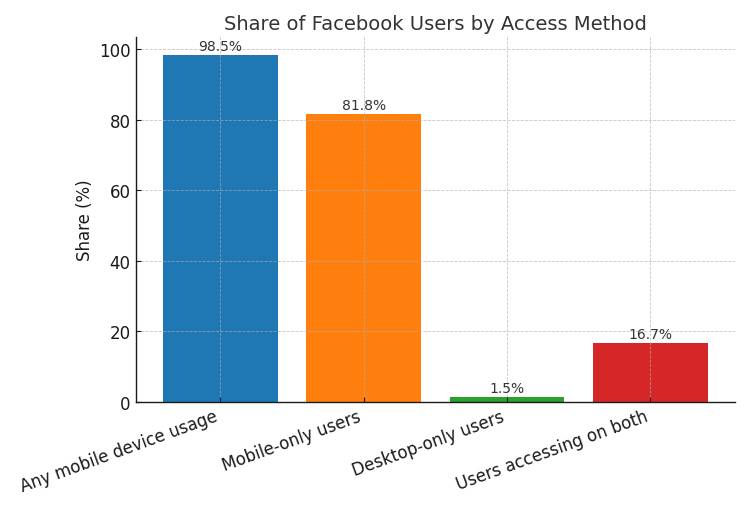
About 98.5% of Facebook users access the platform through a mobile device, underscoring how deeply mobile has become the default gateway to the social media giant.
A striking 81.8% of users access Facebook exclusively via mobile, never touching a desktop or laptop interface.
Only 1.5% rely solely on desktop access, while 16.7% use both mobile and desktop methods. This firmly positions mobile as the unrivaled primary access point for nearly all Facebook activity.
The breakdown looks like this:
Access Type
Percentage of Users
Any mobile device
98.5%
Mobile-only
81.8%
Desktop-only
1.5%
Both mobile and desktop
16.7%
These figures highlight that Facebook is effectively a mobile-first platform. Whether you’re posting, scrolling through feeds, watching videos or responding to messages, most people are using their phones — not their PCs — to engage with content.
In practical terms, if you’re planning campaigns or designing content for Facebook, keeping things lightweight, fast, and mobile-optimized isn’t just smart, it’s essential.
What is the average Facebook engagement rate?
Facebook’s engagement rate tends to sit on the low side compared to other platforms, but that doesn’t mean it’s unimportant — it just reflects how people interact differently across networks.
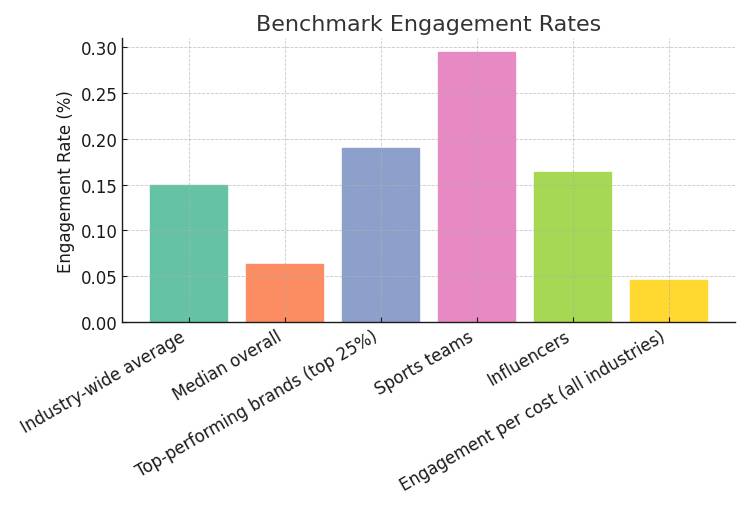
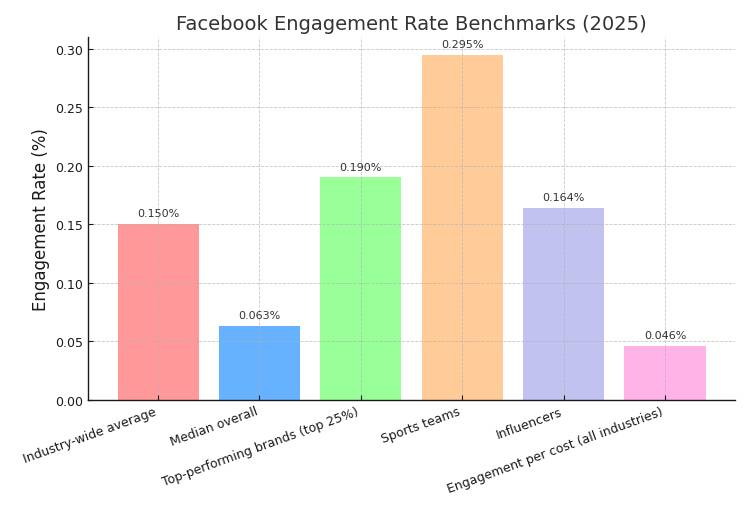
Across all industries, the average engagement rate per post on Facebook hovers around 0.15%, according to some industry-wide benchmarks. This number stays consistent even as new content formats and algorithms evolve.
A deeper dive reveals median rates closer to 0.063%, but the most engaging brands — the top 25% — manage to push that up into the neighborhood of 0.19%.
Putting that into context, a page with 10,000 followers would typically expect 63 interactions per post at the median, but the most engaging pages can see up to 190 interactions — significantly higher.
Engagement also varies widely by industry. For instance, sports teams average around 0.295%, while influencers hit 0.164%. Nonprofits, food & beverage, and health & beauty have lower benchmarks — roughly between 0.1% and 0.2% depending on the specific sector.
On the lower end, some overall benchmarks track engagement per cost at around 0.046%, though that metric isn’t as widely used.
Here’s a quick breakdown to make sense of it all:
Benchmark
Engagement Rate (%)
Industry-wide average
~0.15%
Median overall
~0.063%
Top-performing brands (top 25%)
~0.19%
Sports teams
~0.295%
Influencers
~0.164%
Engagement per cost (all industries)
~0.046%
So, what’s the takeaway? Facebook engagement is modest by number, but that’s expected for a platform where scrolling quickly through content is more common than liking or reacting.
Pages that consistently land at or above 0.1–0.2% are doing well, and if you’re playing in the 0.3% or higher range, you’re part of the upper echelon.
Why do people use Facebook?
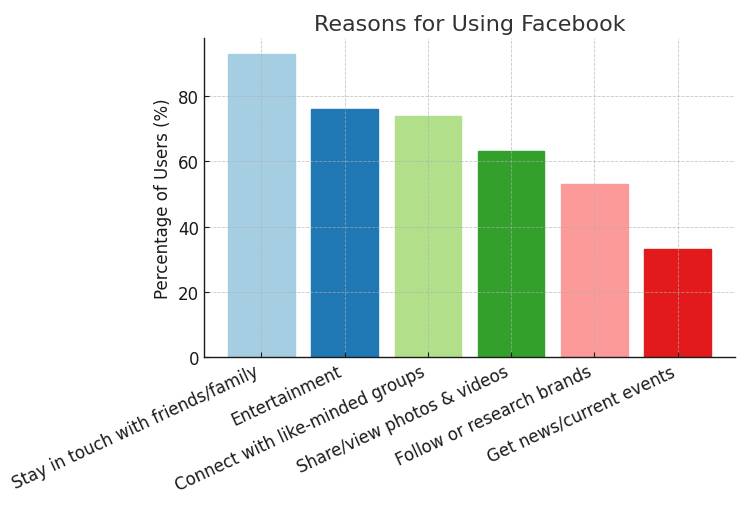
Most Facebook users say they’re on the site to stay connected with friends and family — about 93% cite that as a reason, with 75% calling it a major one.
That tops the list by a mile. After that, entertainment is a big draw — around 76% use Facebook because it’s entertaining. Right behind that, about 74% turn to the platform to connect with others who share their interests.
A good chunk also uses Facebook for sharing and consuming media: 63.2% said they post or view photos and videos, while 53% use it to follow or research brands and products. Even catching up on news matters: 33% of users regularly get updates through Facebook.
When you put all that into a table, here’s the breakdown:
Reason for Using Facebook
Percentage of Users
Stay in touch with friends/family
93%
Entertainment
76%
Connect with like-minded groups
74%
Share/view photos & videos
63.2%
Follow or research brands
53%
Get news/current events
33%
Peeling back the layers, Facebook functions as a digital hub for relationships and leisure—it’s where people go to keep up with loved ones, unwind, explore their interests, and stay in the loop about brands, events, or news.
Each visit may serve a different mix of purposes for different users, but those core motivations remain fairly universal: connection and content.
All told, whether someone is logging in to catch up, kill time, shop, or stay informed, Facebook remains a central platform—largely driven by personal networks, shared experiences, and media.
How much money does Meta (Facebook) make a year?
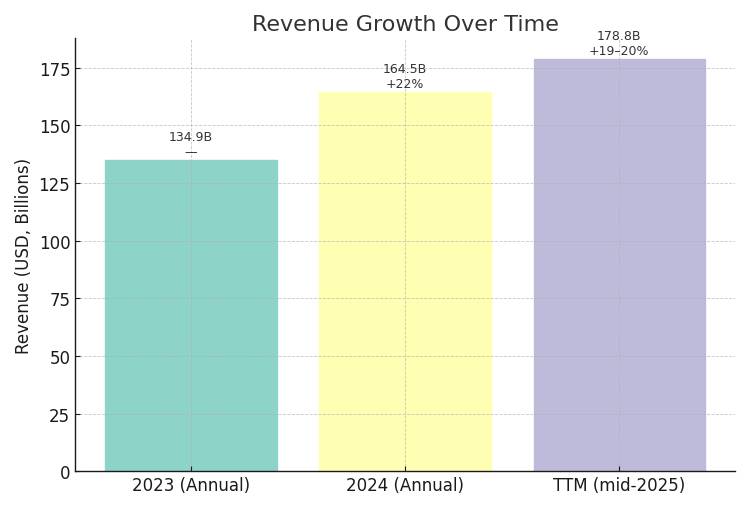
Meta reported a full-year revenue of $164.5 billion for 2024, marking an impressive 22% increase from the $134.9 billion it generated in 2023. This upward climb underscores both the strength of its ad-driven business model and its continued global reach.
If we zoom out to look at trailing twelve-month data, the number climbs even higher—to approximately $178.8 billion, indicating that Meta is on pace to continue this robust growth trajectory well into 2025.
Although most of Meta’s revenue comes from advertising within its Family of Apps—Facebook, Instagram, Messenger, WhatsApp, and others—other segments like Reality Labs and services like WhatsApp Business Platform have also started to add small but growing contributions, especially in 2024.
Here’s a quick snapshot in table form:
Year / Period
Revenue (USD)
Year-over-Year Growth
2023 (Annual)
$134.9 billion
—
2024 (Annual)
$164.5 billion
+22%
TTM (as of mid-2025)
$178.8 billion
+19–20%
These numbers bring home the point that Meta is essentially one of the biggest machines in tech: it’s turning social engagement into serious revenue, largely through ads, and is evolving to explore new frontiers like AI integration and virtual reality—even as those newer segments grow from relatively modest beginnings.
How many employees does Facebook have?
Meta Platforms—the parent company behind Facebook—has seen its workforce fluctuate significantly over recent years.
As of mid-2025 (June 30), the company employed approximately 75,945 people worldwide, marking a 2.5% increase since the end of 2024 when headcount stood at 74,067. (10.0% growth from 2023 to 2024).
Here’s a snapshot of this staffing trajectory:
Year / Period
Number of Employees
Change (%)
End of 2022
86,482
—
End of 2023
67,317
–22.2%
End of 2024
74,067
+10.0%
Mid-2025 (June 30)
75,945
+2.5%
The rapid drop from 86,482 employees in 2022 to 67,317 in 2023 reflects a period of workforce contraction, likely tied to post-pandemic restructuring and efficiency initiatives. Since then, Meta has been rebuilding its team—adding thousands of roles and regrouping after those cuts.
Despite its nickname as “Facebook,” Meta’s reach extends far beyond the platform itself, with teams working across Instagram, WhatsApp, Messenger, Reality Labs, and other ventures.
The “rebound” in headcount points to renewed investment in areas like artificial intelligence, metaverse development, and platform innovation.
So, in a nutshell: Meta’s headcount today floats in the mid-70,000s, making it one of the larger employers in the global tech landscape, but it’s a far cry from its peak just a few years ago.
Looking at the numbers and the narratives, it’s clear that both virtual assistants and Facebook represent more than just tools—they’re reflections of how people and businesses evolve in the digital age.
Virtual assistants highlight the shift toward efficiency, remote collaboration, and flexibility, providing tailored solutions across industries from healthcare to entrepreneurship.
Meanwhile, Facebook continues to serve as a digital gathering place, its statistics revealing how deeply it influences communication, marketing, and even daily routines.
Together, they underscore a bigger truth: technology is no longer simply about innovation, it’s about integration into the human experience.
Whether it’s a VA managing a business owner’s calendar or Facebook connecting billions across continents, these platforms are not just responding to trends—they are creating them.
And as both fields expand, with virtual assistants poised for massive growth and Facebook adapting to shifting demographics and engagement patterns, the coming years will likely see even deeper reliance on these technologies, shaping the way we live, work, and interact in ways that feel almost second nature.
Mark is specialising in robotics engineering. With a background in both engineering and AI, he is driven to create cutting-edge technology. In his free time, he enjoys playing chess and practicing his strategy.